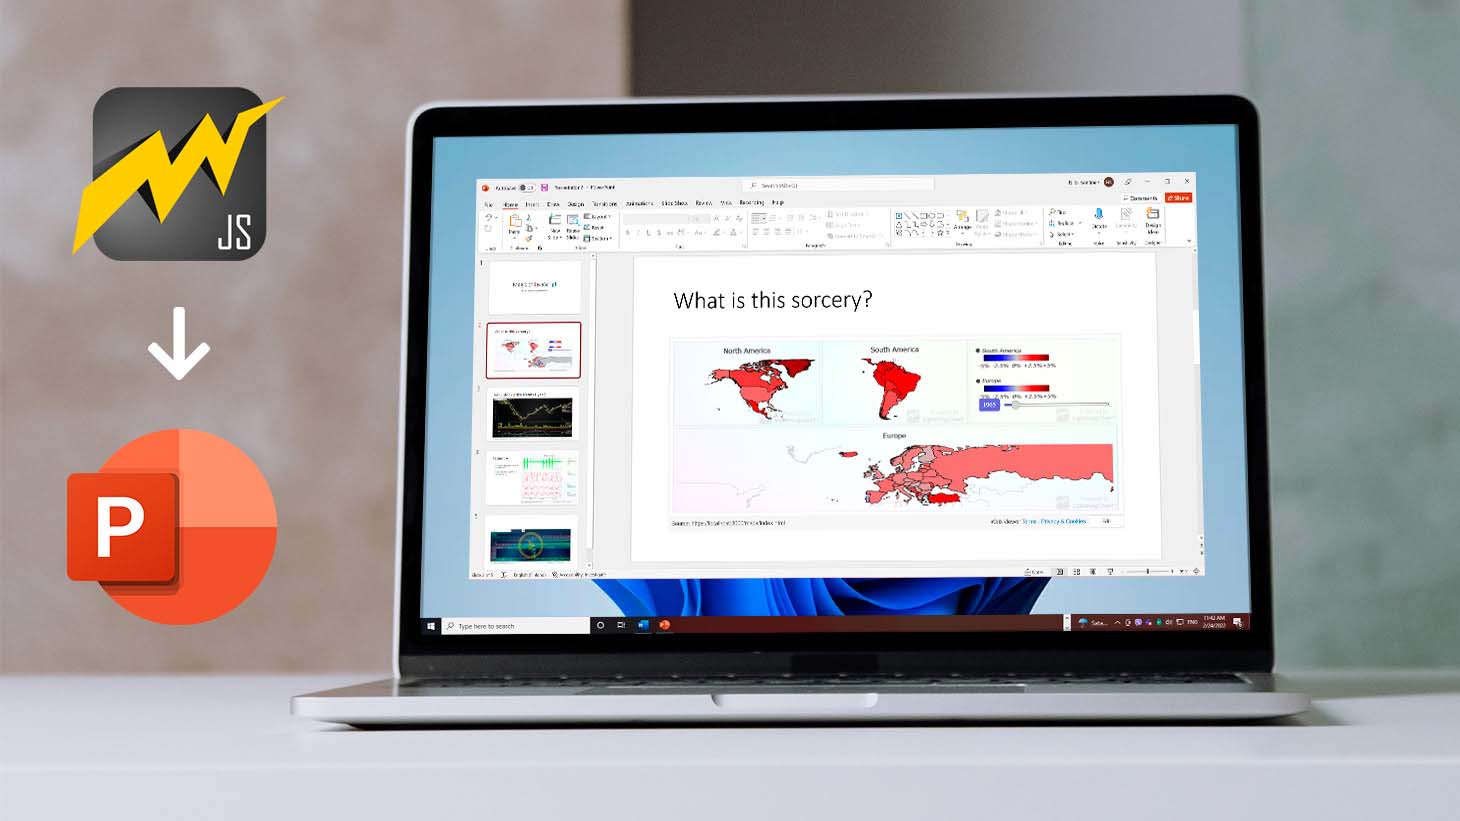
Posts by

Niilo Keinänen

The CTO of LightningChart JS. I specialize in high-performance data transfer and visualization.

Real-time-data-visualization-with-LightningChart-JS-and-WebSocket

Real-time data visualization with WebSockets

These days it is ever increasingly common that people require web solutions for their applications and services.

Data visualization is not an exception to this, as different graphs, visuals, and charts are continuously being integrated into different web applications and sites.

This blog looks into the interesting use case of real-time data visualization with a large scope, including the logistics of data transfer.

Read full article

Easy geospatial data visualization with LightningChart JS and Google

This article showcases and describes a particular use case of LightningChart JS, a JavaScript charting tool designed for performance intensive and real-time charting solutions.

The Google Static Maps API is a software service that makes it easy to embed pictures of maps into web sites. We're going to briefly show how to use the Maps API and combine it with LightningChart JS, allowing the use of any XY data visualization feature above the maps.

Read full article

Data Visualization Components for React Applications

React is one of the most popular front-end development frameworks on the web in the year 2021. It is a free and open-source front-end JS library that is used to build interactive user interfaces for Single Page Applications (SPAs).

(Its rising popularity comes from the fact that it can be used by a user with a basic understanding of HTML and JavaScript!)

But not only that, React data visualization becomes efficient with its distinct features such as virtual DOM and JSX. Visualizing a large amount of data can be a tedious task!

Read full article
JavaScript Data Visualization with LightningChart JS

Javascript Data Visualization With LightningChart JS

LightningChart JS is the top contestant for next-generation data visualization tools for web and mobile applications. From the start, it has been engineered to deal with maximum-size data sets and stressful usage cases.

With already 21 versions out, we have come a long way from where we started. Now would be a good time to reflect on why is LightningChart JS revolutionary?

Read full article