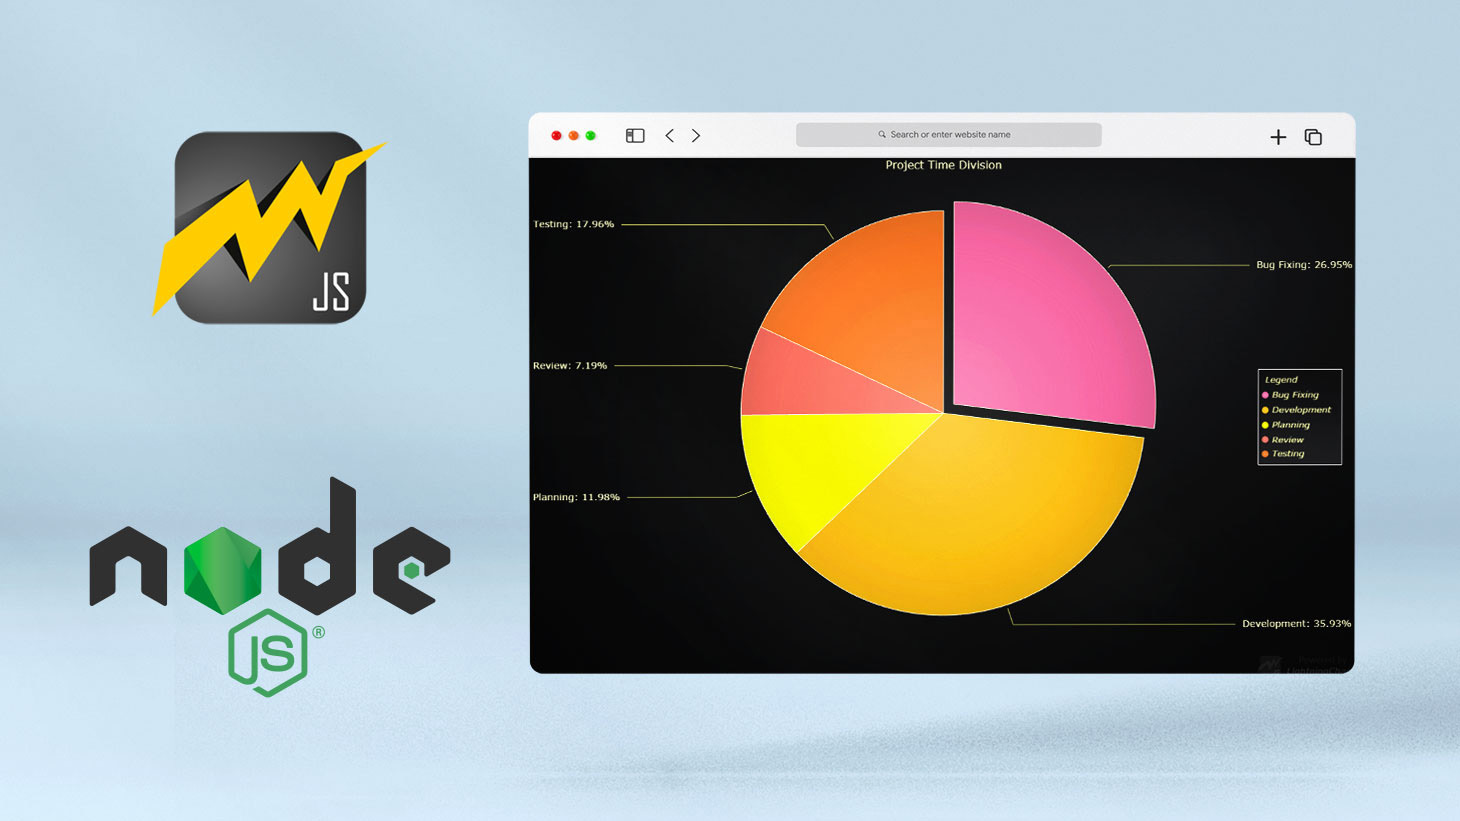
Create a JavaScript Pie Chart with NodeJS, TypeScript & LightningChart
LightningChart is an API focused on data representation, using a wide variety of charts (2D and 3D), with an intuitive implementation and wide compatibility with various development platforms.
There are currently two solutions for developing with LightingCharts.
- LightningChart .NET for desktop applications (supports WPF, UWP, and WinForms)
- LightningChart JS for web, mobile, and desktop applications.
Today, we are going to do a short tutorial on how to generate a pie chart using Node JS, TypeScript, and LigningCharts JS.
To see how to get LightningChart JS for free, visit the Community license page.


.jpeg)
