Create a vibration charts application with 2D & 3D spectrograms
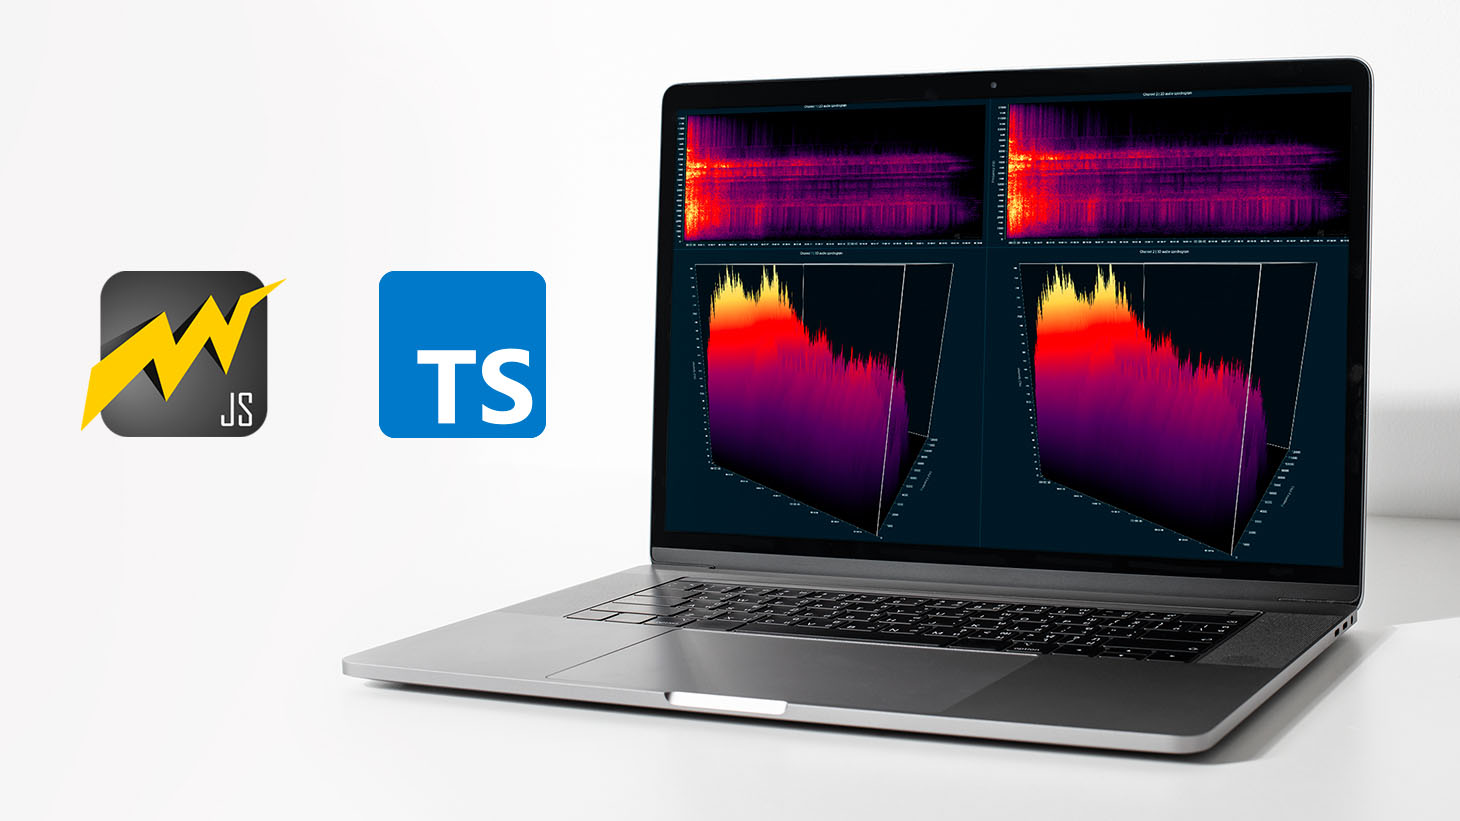
Hello, in this article we will create a JS dashboard with 2D and 3D spectrogram charts.
The purpose of creating this project is to explain how to create a vibration analysis application that allows us to check sound waves using 2D and 3D spectrogram charts that LightningCharts JS provides us with its lcjs library.
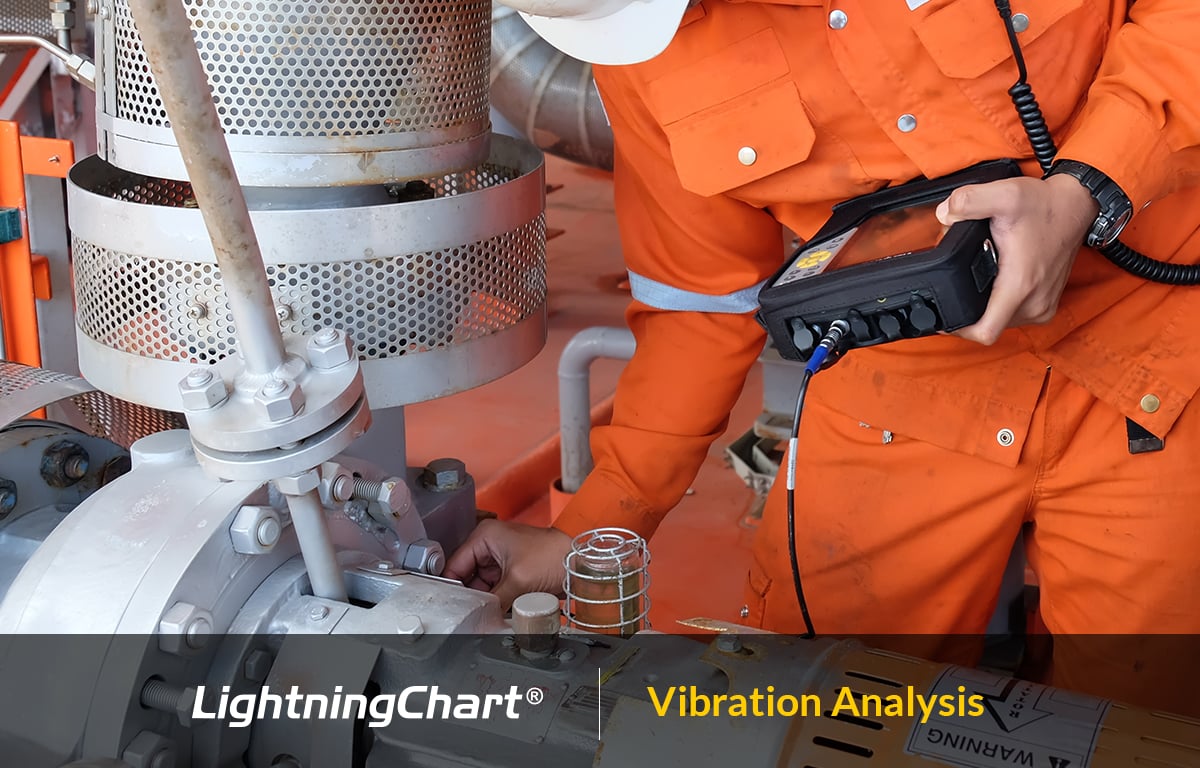
Vibration analysis is of great importance in detecting errors and/or faults in industrial equipment (just to mention one example).
I once worked in the industry and I remember that it was possible to detect failures in relief valves, air coolers, and compression elements, simply by listening to the intensity of the sound they generated.
With the chart that we are going to build next, we will see an audio file corresponding to a similar case.