Javascript Data Visualization With LightningChart JS
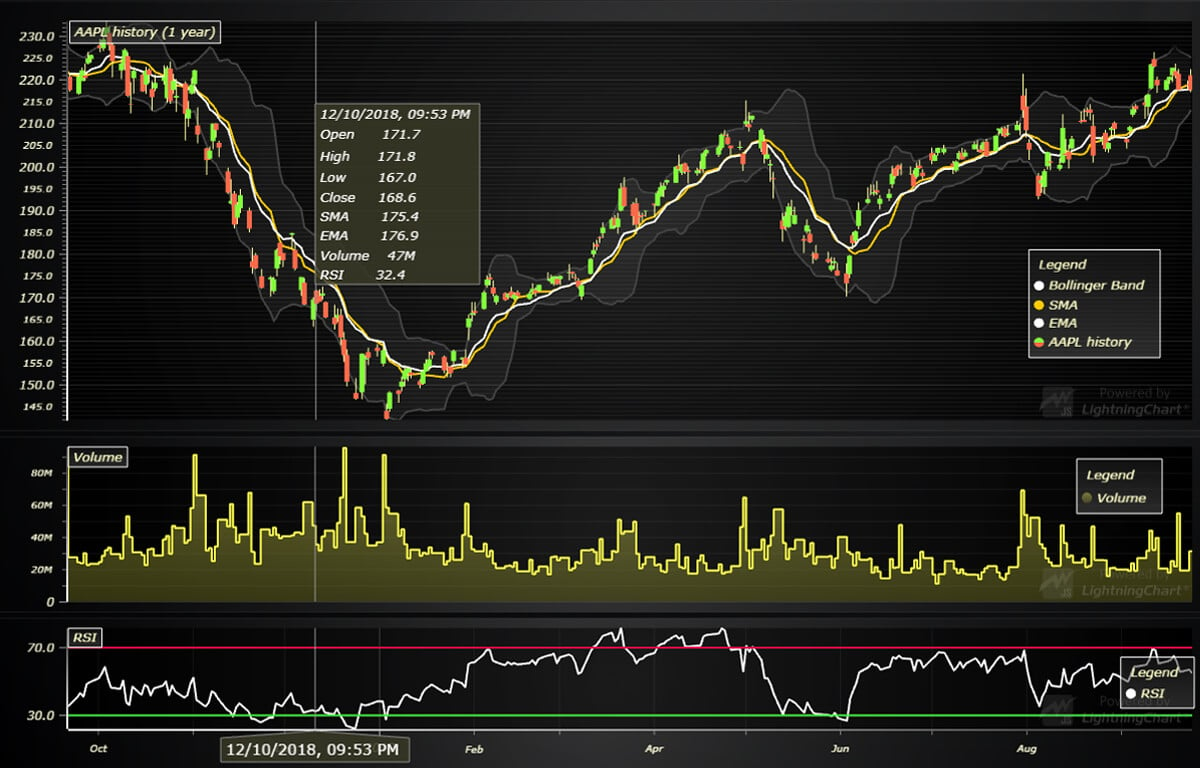
LightningChart JS is the top contestant for next-generation data visualization tools for web and mobile applications. From the start, it has been engineered to deal with maximum-size data sets and stressful usage cases.
With already 21 versions out, we have come a long way from where we started. Now would be a good time to reflect on why is LightningChart JS revolutionary?
